

搜索到
12
篇与
的结果
-
 Typecho + JOE 主题下 Mermaid 渲染的解决方案 阅前须知:由于博主现在 并没有太多自己写代码甚至脚本的能力 ,本篇文章在我和AI共同解决了这个问题之后 直接由AI生成 ,若你对此感到反感,可以现在 关闭该帖 ( 我是废物 )一、问题背景在 Typecho 中使用 Mermaid 一直不算难,但一旦换成 JOE 主题,问题就开始变得复杂:写好的 `mermaid 代码块被当成普通代码高亮插件明明启用了,但图表不渲染翻页(PJAX)后 Mermaid 直接失效我一开始也尝试用常规方案(正则替换 HTML),结果发现:👉 根本不稳定二、问题的本质JOE 主题做了很多“增强”,包括:自定义代码高亮(Prism / Highlight.js)改写 Markdown 输出结构使用 PJAX(局部刷新页面)这导致一个核心问题:你在后端生成的 HTML,很可能在前端被再次修改甚至覆盖例如你期望的是:<pre><code class="language-mermaid"></code></pre>但实际可能变成:<pre class="language-mermaid"></pre>甚至:<div class="joe_code"> <pre>...</pre> </div>👉 结构不稳定 → 正则必炸三、传统方案为什么不行?常见插件思路:Markdown → HTML → 正则替换 → <pre class="mermaid">问题在于:依赖 HTML 结构(不可靠)容易被主题覆盖PJAX 后不会重新执行结论:后端改 HTML,在 JOE 这种强主题下是错误方向四、最终解决方案:前端接管我最后采用的是:✅ 完全绕过后端,前端动态解析 Mermaid核心流程:页面加载 ↓ 扫描所有 language-mermaid 代码块 ↓ 替换为 .mermaid DOM ↓ 调用 Mermaid 渲染五、核心实现解析1. 扫描代码块const blocks = document.querySelectorAll( 'pre code.language-mermaid, pre.language-mermaid' );为什么这样写?👉 兼容两种结构:<pre><code class="language-mermaid"></code></pre><pre class="language-mermaid"></pre>2. 提取原始代码let code = codeBlock.textContent;👉 直接拿文本,不依赖 HTML 结构3. 重建 DOMconst container = document.createElement('div'); container.className = 'mermaid-container'; const mermaidDiv = document.createElement('div'); mermaidDiv.className = 'mermaid'; mermaidDiv.textContent = code; container.appendChild(mermaidDiv);最终结构:<div class="mermaid-container"> <div class="mermaid">...</div> </div>4. 替换原代码块pre.replaceWith(container);👉 关键点:删除原代码高亮 DOM避免主题再次干扰5. 渲染 Mermaidmermaid.initialize({ startOnLoad: false, theme: getTheme() }); mermaid.init(undefined, document.querySelectorAll('.mermaid'));为什么不用自动加载?👉 因为 DOM 是动态生成的6. 防止重复渲染if (codeBlock.dataset.mermaidDone) return;👉 防止:PJAX 重复执行多次渲染报错7. 适配 PJAX(关键)document.addEventListener('pjax:complete', run);👉 没有这行:❌ 翻页后 Mermaid 全部失效六、主题适配(暗黑模式)function getTheme() { if (document.body.classList.contains('dark')) { return 'dark'; } return 'default'; }👉 自动跟随主题切换七、为什么这个方案最稳?对比一下:方案稳定性原因后端正则替换❌依赖 HTML修改 Markdown 解析❌被主题覆盖前端接管(本方案)✅直接操作 DOM八、核心设计思想这次优化本质上是一次“架构调整”:1️⃣ 不和主题抢控制权JOE 已经接管了渲染链:👉 你再插手,只会冲突2️⃣ 前端才是最终执行层只要页面上存在:language-mermaid👉 就一定能识别3️⃣ 幂等设计data-mermaidDone👉 保证多次执行不会出问题九、最终效果✅ 支持所有 Mermaid 图✅ 支持 PJAX✅ 不受代码高亮影响✅ 自动暗黑模式✅ 主题无关(通用)十、一句话总结与其试图修补被主题打乱的 HTML,不如直接绕过它,在前端重建渲染链。十一、源码附上{collapse}{collapse-item label="过长,已折叠,点击查看" close}<?php if (!defined('__TYPECHO_ROOT_DIR__')) exit; /** * Mermaid 插件(JOE终极兼容版 / 前端解析) * * @package MermaidUltimate * @version 2.0.0 */ class Mermaid_Plugin implements Typecho_Plugin_Interface { public static function activate() { Typecho_Plugin::factory('Widget_Archive')->header = array('Mermaid_Plugin', 'header'); Typecho_Plugin::factory('Widget_Archive')->footer = array('Mermaid_Plugin', 'footer'); } public static function deactivate() {} public static function config(Typecho_Widget_Helper_Form $form) { $cdn = new Typecho_Widget_Helper_Form_Element_Text( 'cdn', null, 'https://cdn.jsdelivr.net/npm/mermaid@10/dist/mermaid.min.js', _t('Mermaid CDN'), _t('推荐 jsdelivr 或 npmmirror') ); $form->addInput($cdn); $theme = new Typecho_Widget_Helper_Form_Element_Select( 'theme', array( 'default' => 'Default', 'dark' => 'Dark', 'forest' => 'Forest', 'neutral' => 'Neutral', ), 'default', _t('主题'), _t('Mermaid 渲染主题') ); $form->addInput($theme); $autoDark = new Typecho_Widget_Helper_Form_Element_Radio( 'autoDark', array( '1' => '开启', '0' => '关闭' ), '1', _t('自动暗黑模式'), _t('根据 JOE 主题自动切换') ); $form->addInput($autoDark); } public static function personalConfig(Typecho_Widget_Helper_Form $form) {} public static function header() { echo '<style> .mermaid-container { text-align: center; margin: 1em 0; } </style>'; } public static function footer() { $options = Helper::options()->plugin('Mermaid'); $cdn = $options->cdn ?: 'https://cdn.jsdelivr.net/npm/mermaid@10/dist/mermaid.min.js'; $theme = $options->theme ?: 'default'; $autoDark = $options->autoDark; echo <<<HTML <script src="{$cdn}"></script> <script> (function () { function getTheme() { if ({$autoDark} == 1) { if (document.documentElement.classList.contains('dark') || document.body.classList.contains('dark')) { return 'dark'; } } return '{$theme}'; } function convertMermaid() { // 找到所有 mermaid 代码块 const blocks = document.querySelectorAll( 'pre code.language-mermaid, pre.language-mermaid' ); blocks.forEach(function(codeBlock) { // 防重复处理 if (codeBlock.dataset.mermaidDone) return; codeBlock.dataset.mermaidDone = "1"; let code = codeBlock.textContent; // 创建容器 const container = document.createElement('div'); container.className = 'mermaid-container'; const mermaidDiv = document.createElement('div'); mermaidDiv.className = 'mermaid'; mermaidDiv.textContent = code; container.appendChild(mermaidDiv); // 替换整个 pre let pre = codeBlock.closest('pre'); if (pre) { pre.replaceWith(container); } else { codeBlock.replaceWith(container); } }); } function renderMermaid() { if (typeof mermaid === 'undefined') { console.warn('Mermaid not loaded'); return; } try { mermaid.initialize({ startOnLoad: false, theme: getTheme() }); mermaid.init(undefined, document.querySelectorAll('.mermaid')); } catch (e) { console.error('Mermaid error:', e); } } function run() { convertMermaid(); renderMermaid(); } // 首次加载 document.addEventListener('DOMContentLoaded', run); // JOE PJAX document.addEventListener('pjax:complete', function () { run(); }); })(); </script> HTML; } }{/collapse-item}{/collapse}十二、使用方法:把这个文件放到:/usr/plugins/Mermaid/Plugin.php进入 Typecho 后台: 控制台 → 插件 → 启用 Mermaid 写文章时使用 Mermaid就直接在 Markdown 里写:发布后就会自动渲染成图。
 -
使用screen/tmux命令实现SSH中任务后台运行 前言:在我们使用ssh的时候正常情况下,如果我们退出ssh,进程会被杀掉,导致一些需要运行较长时间(比如 rsync/cp )的命令中断,十分的难受,这里提供两种解决办法:1.使用screen1.1开启 screen:screen -S upload1.2执行命令##举例 rsync -avh --progress /data/myfolder/ /mnt/myfolder/1.3退出SSH保持后台运行:按:Ctrl + A 然后按 D1.4重新连接后恢复screen -r upload2.使用tmux2.1启动tmuxtmux new -s upload2.2执行命令后,退出保持后台Ctrl + B 然后按 D2.3重新连接后恢复tmux attach -t upload
-
Linux环境下的Silly Tavern 云酒馆 AI 搭建与美化完善(几乎0基础?) {alert type="info"}感谢McD大佬的指导{/alert}前言Silly Tavern Chat(云酒馆) 是一个强大的AI Role Play网站,依赖于庞大的社区资源,可以实现多样化的角色互动。 支持国内外多种AI模型,有着比较直观 但一点也不好看 的用户界面。其实酒馆ai可以直接部署在很多设备上(安卓,Windows),但是不便于多端同步等等,将酒馆部署在云端可以使用WebUI方便的使用任何设备访问酒馆。下面是从0开始的云端Silly Tavern部署教程。前期准备{x} 一台至少1核2G的云服务器(推荐JP区域){x} 本地SSH工具(我使用的是termius){x} 一点点linux基本使用技巧{x} 已对Silly Tavern有一定了解{x} 最好加入了类脑ΟΔΥΣΣΕΙΑ社区,截至2026/03/12仍然是开放状态开始部署0.SSH的连接0.1打开Termius(这里以电脑版举例)0.2点击 NEW HOST,在红框内填写IDC商家提供给你的信息( Lable 就是你给vps起的名字)0.3点击 Connect 连接1.安装1panel面板为了方便萌新进行后续反代等等的搭建,建议先安装1p。输入下方这串命令,按提示操作(提示是否安装docker时直接按enter键)bash -c "$(curl -sSL https://resource.fit2cloud.com/1panel/package/v2/quick_start.sh)"{alert type="warning"}安装完之后一定要记住访问地址与端口号!{/alert}2.获取项目2.1首先安装gitsudo apt update ##一行一行执行 sudo apt install git2.2从github拉取项目git clone https://github.com/SillyTavern/SillyTavern等待一会拉取3.启动容器,调整参数3.1启动容器cd SillyTavern/docker docker compose up -d3.2编辑配置文件sudo nano config/config.yaml此时进入到你 config 配置文件点击向下,直到看到 whitelistMode 把后面的 true 改为 false 再往下找到basicAuthMode把false改为true最后在下方设置你的账号密码按 ctrl+O ,再按 enter 接着按 ctrl+X 保存退出nano编辑器3.3重启容器,使改动生效docker compose restart sillytavern到此处恭喜你酒馆AI搭建已经完成。打开浏览器输入 http://<你的ip>:8000 访问界面4.基础参数设置打开WebUI跟随它的提示进行填写,这里不多提。5.美化先贴一张效果图我使用的是类脑频道里面这位大佬的美化方案这个美化很重要的一点就是对手机端非常友好:在滑动 正则 时不会误触改变顺序没有进频道的我这里提供下载链接修改方式如下:6.优化与增强在最上面一栏从右往左第三个里可以安装拓展,从而增强酒馆游玩的舒适度主要是下面这几个:6.1酒馆助手这是项目地址6.2提示词模板这是项目地址6.3文生图插件这是项目地址7.域名反代{ } 待完成
-
IOS系统解压.lz4格式压缩包 前言大家可能会遇到lz4格式的压缩包(多见于防止用户 手贱 在线解压的网盘资源),这时安卓可以使用ZArchiver方便的解压,但是ios就不行了,这里分享一个基于iSH的解压教程。开整1.下载iSH这里用到了一个叫做iSH的工具,这是一个适用于 iOS 设备的开源终端模拟器,相当于一个轻量化的linux环境。直接打开AppStore搜索 iSH 下载 2.打开 iSH,安装 lz4apk add lz43.把.lz4文件导入iSH通过“文件”App分享 → iSH)4.开始解压lz4 -d <XXX.lz4> <输出文件名> #注:自行替换尖括号里面的内容为实际名称{collapse}{collapse-item label="example" close}lz4 -d test.lz4 test.rar{/collapse-item}{/collapse}5.验证解压结果ls -a
-
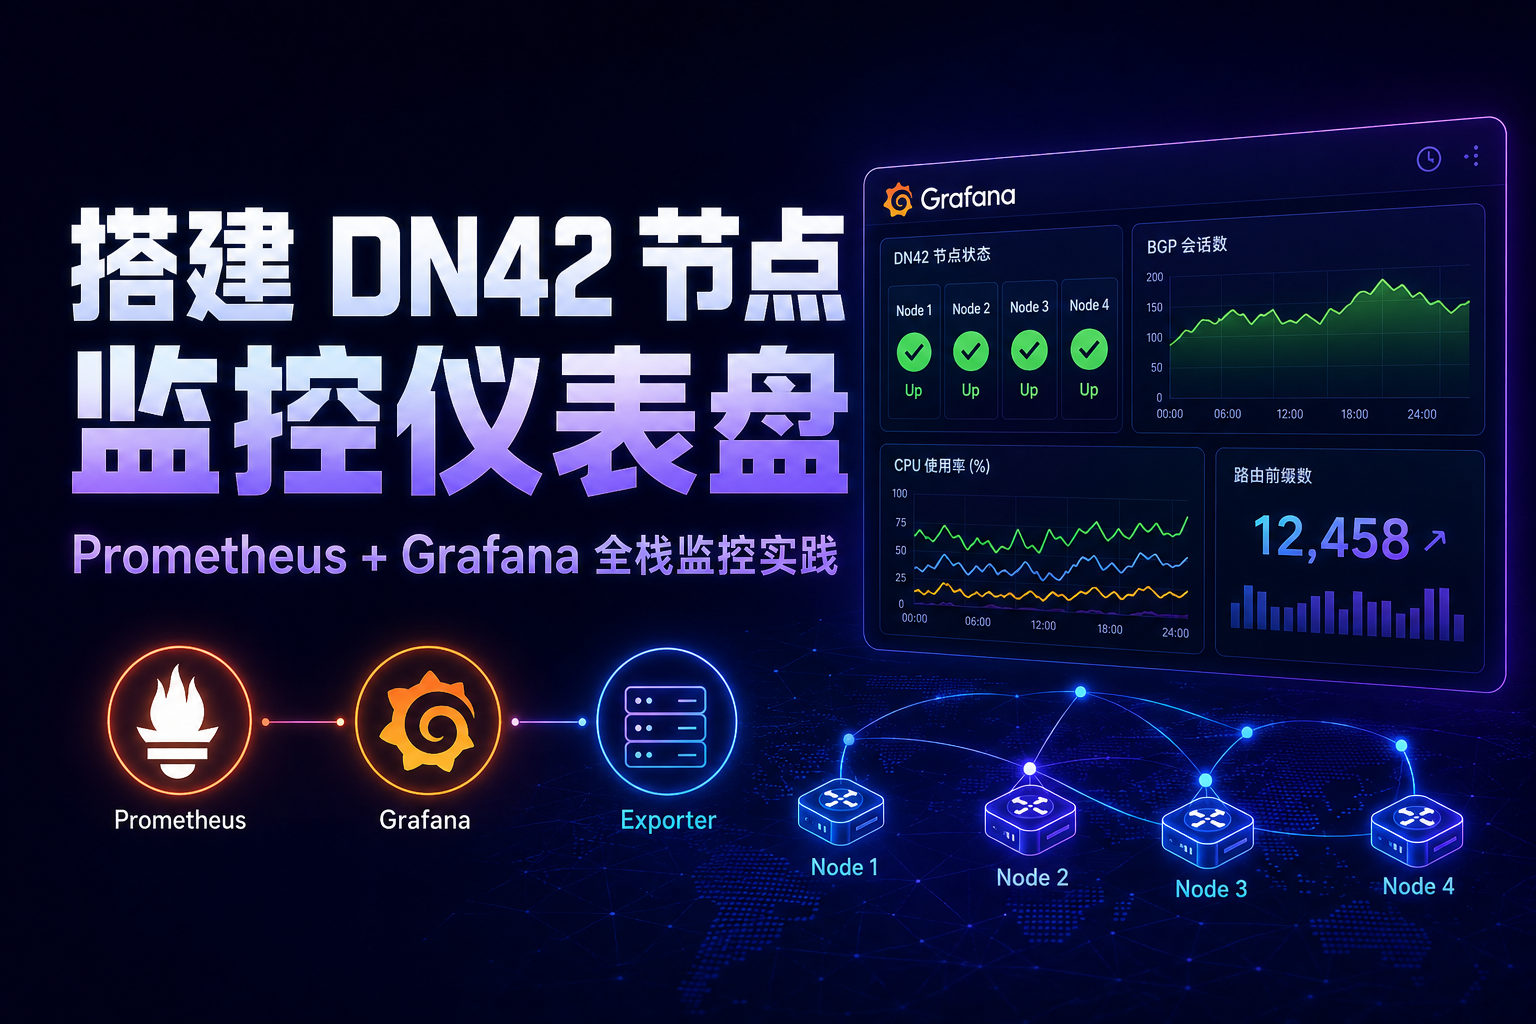
搭建Grafana监测Bird运行状态 写在前面本人在dn42网络中有4个节点,本来搭建了LookingGlass来监测节点运行状态,但考虑到不够直观 其实是想折腾,所以打算搭建一个可以图形化监控每台节点Bird运行状态的仪表盘,在社区里面发现可以用Grafana搭配Prometheus作为数据源实现拓扑图如下:graph TD subgraph DN42 Network N1[Node 1] --> NE1(Node Exporter) N1 --> BE1(Bird/FRR Exporter) N2[Node 2] --> NE2(Node Exporter) N2 --> BE2(Bird/FRR Exporter) N3[Node 3] --> NE3(Node Exporter) N3 --> BE3(Bird/FRR Exporter) N4[Node 4] --> NE4(Node Exporter) N4 --> BE4(Bird/FRR Exporter) end NE1 --> P(Prometheus Server) NE2 --> P NE3 --> P NE4 --> P BE1 --> P BE2 --> P BE3 --> P BE4 --> P P --> G(Grafana Server) User[用户] --> G搭建部署 Prometheus ServerPrometheus Server 将运行在独立的监控服务器上。创建工作目录mkdir -p /opt/prometheus/config /opt/prometheus/data创建 Prometheus 配置文件 (/opt/prometheus/config/prometheus.yml)global: scrape_interval: 15s # 默认抓取间隔 scrape_configs: - job_name: 'prometheus' static_configs: - targets: ['localhost:9090'] # 监控 Prometheus 自身 - job_name: 'node_exporter' static_configs: - targets: ['<node1_ip>:9100', '<node2_ip>:9100', '<node3_ip>:9100', '<node4_ip>:9100'] # 替换为您的 DN42 节点 IP - job_name: 'bird_exporter' static_configs: - targets: ['<node1_ip>:9324', '<node2_ip>:9324', '<node3_ip>:9324', '<node4_ip>:9324'] # 替换为您的 DN42 节点 IP注意: 请将 <nodeX_ip> 替换为您的 DN42 节点的实际 IP 地址。使用 Docker Compose 部署 Prometheus创建 docker-compose.yml 文件:services: prometheus: image: prom/prometheus container_name: prometheus network_mode: host ports: - "9090:9090" volumes: - /opt/prometheus/config/prometheus.yml:/etc/prometheus/prometheus.yml - /opt/prometheus/data:/prometheus command: - '--config.file=/etc/prometheus/prometheus.yml' - '--storage.tsdb.path=/prometheus' - '--web.enable-lifecycle' restart: unless-stopped将数据目录的权限赋予 Prometheus 用户:chown -R 65534:65534 /opt/prometheus/data启动 Prometheus:docker-compose up -d通过访问 http://<监控服务器IP>:9090 来验证 Prometheus 是否正常运行。部署 Node Exporter (每个 DN42 节点上)创建工作目录mkdir -p /opt/node_exporter方式1:使用 Docker 部署 Node Exporterdocker run -d \ --name node_exporter \ --net="host" \ --pid="host" \ -v "/:/host:ro,rslave" \ quay.io/prometheus/node-exporter:latest \ --path.rootfs=/host方式2:使用二进制可执行文件部署 Node Exporter下载并解压 Node Exporter访问 Prometheus 下载页面 获取最新版本的 Node Exporter。以下示例使用 1.7.0 版本wget https://github.com/prometheus/node_exporter/releases/download/v1.7.0/node_exporter-1.7.0.linux-amd64.tar.gz tar xvfz node_exporter-1.7.0.linux-amd64.tar.gz sudo cp node_exporter-1.7.0.linux-amd64/node_exporter /usr/local/bin sudo chown prometheus:prometheus /usr/local/bin/node_exporter rm -rf node_exporter-1.7.0.linux-amd64.tar.gz node_exporter-1.7.0.linux-amd64创建 Systemd 服务文件 (/etc/systemd/system/node_exporter.service)[Unit] Description=Node Exporter Wants=network-online.target After=network-online.target [Service] Type=simple ExecStart=/usr/local/bin/node_exporter \ --web.listen-address=":9100" \ --collector.textfile.directory="/var/lib/node_exporter/textfile_collector" [Install] WantedBy=multi-user.target重新加载 Systemd 并启动 Node Exportersudo systemctl daemon-reload sudo systemctl start node_exporter sudo systemctl enable node_exporterBird Exporter首先,确保 BIRD 配置允许 bird_exporter 访问其控制套接字。通常需要在 /etc/bird/bird.conf 或 /etc/bird2/bird.conf 中添加类似以下内容:control socket "/var/run/bird/bird.ctl" mode 0777;然后,使用 Docker 部署 Bird Exporter (推荐用于内存充足的节点):docker run -d \ --name bird_exporter \ --network host \ -v /var/run/bird/bird.ctl:/var/run/bird/bird.ctl \ czerwonk/bird_exporter:latest使用二进制方式部署 Bird Exporter下载并解压 Bird Exporter访问 Bird Exporter GitHub Releases 获取最新版本的 Bird Exporter。以下示例使用 1.1.0 版本,请根据实际情况替换。wget https://github.com/czerwonk/bird_exporter/releases/download/v1.1.0/bird_exporter-1.1.0.linux-amd64.tar.gz tar xvfz bird_exporter-1.1.0.linux-amd64.tar.gz sudo cp bird_exporter-1.1.0.linux-amd64/bird_exporter /usr/local/bin sudo chown prometheus:prometheus /usr/local/bin/bird_exporter rm -rf bird_exporter-1.1.0.linux-amd64.tar.gz bird_exporter-1.1.0.linux-amd64创建 Systemd 服务文件 (/etc/systemd/system/bird_exporter.service)[Unit] Description=Bird Exporter Wants=network-online.target After=network-online.target [Service] Type=simple ExecStart=/usr/local/bin/bird_exporter \ --bird.socket="/var/run/bird/bird.ctl" \ --web.listen-address=":9324" [Install] WantedBy=multi-user.target重新加载 Systemd 并启动 Bird Exportersudo systemctl daemon-reload sudo systemctl start bird_exporter sudo systemctl enable bird_exporter部署 Grafana ServerGrafana Server 建议与 Prometheus Server 部署在同一台监控服务器上。创建工作目录mkdir -p /opt/grafana/data4.4.2 使用 Docker Compose 部署 Grafana更新之前创建的 docker-compose.yml 文件,添加 Grafana 服务:services: prometheus: image: prom/prometheus container_name: prometheus ports: - "9090:9090" volumes: - /opt/prometheus/config/prometheus.yml:/etc/prometheus/prometheus.yml - /opt/prometheus/data:/prometheus command: - '--config.file=/etc/prometheus/prometheus.yml' - '--storage.tsdb.path=/prometheus' - '--web.enable-lifecycle' restart: unless-stopped grafana: image: grafana/grafana container_name: grafana ports: - "3000:3000" volumes: - /opt/grafana/data:/var/lib/grafana environment: - GF_SECURITY_ADMIN_USER=admin - GF_SECURITY_ADMIN_PASSWORD=your_strong_password # 请替换为强密码 depends_on: - prometheus restart: unless-stopped重新启动 Docker Compose 服务以启动 Grafana:docker-compose up -d配置 Grafana 数据源登录 Grafana。在左侧导航栏中,点击齿轮图标 (Configuration) -> Data Sources。点击 Add data source。选择 Prometheus。在 HTTP 部分的 URL 字段中输入 http://prometheus:9090 (如果 Prometheus 和 Grafana 在同一个 Docker Compose 网络中) 或 http://localhost:9090 (如果 Prometheus 运行在宿主机上,且 Grafana 可以直接访问)。点击 Save & Test。如果一切正常,您将看到 Data source is working 的消息。导入 Grafana 仪表盘Grafana 社区提供了许多现成的仪表盘,可以大大简化监控配置。以下是一些推荐的仪表盘 ID:Node Exporter Full: ID 1860 (或搜索 Node Exporter Full),用于监控主机操作系统指标。BIRD RS: ID 5259 (或搜索 BIRD RS),用于监控 BIRD 路由协议状态。FRR Exporter - BGP: ID 22943 (或搜索 FRR Exporter - BGP),用于监控 FRR BGP 状态。导入步骤在 Grafana 左侧导航栏中,点击 + 图标 (Create) -> Import。在 Import via grafana.com 字段中输入上述仪表盘 ID,然后点击 Load。选择您的 Prometheus 数据源。点击 Import。重复此过程,导入所有您需要的仪表盘。告警配置 (可选)Grafana 允许您基于 Prometheus 收集的指标配置告警规则。当指标达到预设阈值时,Grafana 可以通过邮件、Slack、Webhook 等方式发送通知。配置告警通道在 Grafana 左侧导航栏中,点击齿轮图标 (Configuration) -> Alerting -> Notification channels。点击 New channel。选择偏好的通知类型 (例如 Email, Slack) 并填写相关配置信息。点击 Save。创建告警规则打开想要添加告警的仪表盘。选择一个面板,点击面板标题,然后选择 Edit。在面板编辑视图中,切换到 Alert 选项卡。点击 Create Alert。定义告警规则的条件、评估周期和通知通道。点击 Save。分享我的JSON{collapse}{collapse-item label="Sample" close}{ "annotations": { "list": [ { "builtIn": 1, "datasource": { "uid": "-- Grafana --" }, "enable": true, "hide": true, "iconColor": "rgba(0, 211, 255, 1)", "name": "Annotations \u0026 Alerts", "type": "dashboard" } ] }, "description": "Live BIRD routing health, prefix visibility, session status and routing activity across all monitored routers.", "editable": true, "fiscalYearStartMonth": 0, "graphTooltip": 1, "id": 6, "links": [ ], "panels": [ { "datasource": { "type": "prometheus", "uid": "dfdlzb2hrvlz4b" }, "description": "Healthy Prometheus scrape targets for the selected BIRD exporters.", "fieldConfig": { "defaults": { "color": { "mode": "thresholds" }, "mappings": [ ], "thresholds": { "mode": "absolute", "steps": [ { "color": "red", "value": 0 }, { "color": "green", "value": 1 } ] }, "unit": "short" }, "overrides": [ ] }, "gridPos": { "h": 4, "w": 6, "x": 0, "y": 0 }, "id": 10, "options": { "colorMode": "background_solid", "graphMode": "none", "justifyMode": "center", "orientation": "horizontal", "percentChangeColorMode": "standard", "reduceOptions": { "calcs": [ "lastNotNull" ], "fields": "", "values": false }, "showPercentChange": false, "textMode": "auto", "wideLayout": true }, "pluginVersion": "12.3.3", "targets": [ { "datasource": { "type": "prometheus", "uid": "dfdlzb2hrvlz4b" }, "editorMode": "code", "expr": "count(up{job=\"bird_exporter\",instance=~\"$instance\"} == 1) or vector(0)", "format": "time_series", "instant": true, "legendFormat": "__auto", "range": false, "refId": "A" } ], "title": "BIRD Exporters Online", "type": "stat" }, { "datasource": { "type": "prometheus", "uid": "dfdlzb2hrvlz4b" }, "description": "Established BGP sessions across the selected router scope.", "fieldConfig": { "defaults": { "color": { "mode": "thresholds" }, "mappings": [ ], "thresholds": { "mode": "absolute", "steps": [ { "color": "red", "value": 0 }, { "color": "green", "value": 1 } ] }, "unit": "short" }, "overrides": [ ] }, "gridPos": { "h": 4, "w": 6, "x": 6, "y": 0 }, "id": 11, "options": { "colorMode": "background_solid", "graphMode": "none", "justifyMode": "center", "orientation": "horizontal", "percentChangeColorMode": "standard", "reduceOptions": { "calcs": [ "lastNotNull" ], "fields": "", "values": false }, "showPercentChange": false, "textMode": "auto", "wideLayout": true }, "pluginVersion": "12.3.3", "targets": [ { "datasource": { "type": "prometheus", "uid": "dfdlzb2hrvlz4b" }, "editorMode": "code", "expr": "count(bird_protocol_up{proto=\"BGP\",instance=~\"$instance\"} == 1) or vector(0)", "format": "time_series", "instant": true, "legendFormat": "__auto", "range": false, "refId": "A" } ], "title": "BGP Sessions Up", "type": "stat" }, { "datasource": { "type": "prometheus", "uid": "dfdlzb2hrvlz4b" }, "description": "BGP sessions currently not established.", "fieldConfig": { "defaults": { "color": { "mode": "thresholds" }, "mappings": [ ], "thresholds": { "mode": "absolute", "steps": [ { "color": "green", "value": 0 }, { "color": "red", "value": 1 } ] }, "unit": "short" }, "overrides": [ ] }, "gridPos": { "h": 4, "w": 6, "x": 12, "y": 0 }, "id": 12, "options": { "colorMode": "background_solid", "graphMode": "none", "justifyMode": "center", "orientation": "horizontal", "percentChangeColorMode": "standard", "reduceOptions": { "calcs": [ "lastNotNull" ], "fields": "", "values": false }, "showPercentChange": false, "textMode": "auto", "wideLayout": true }, "pluginVersion": "12.3.3", "targets": [ { "datasource": { "type": "prometheus", "uid": "dfdlzb2hrvlz4b" }, "editorMode": "code", "expr": "count(bird_protocol_up{proto=\"BGP\",instance=~\"$instance\"} == 0) or vector(0)", "format": "time_series", "instant": true, "legendFormat": "__auto", "range": false, "refId": "A" } ], "title": "BGP Sessions Down", "type": "stat" }, { "datasource": { "type": "prometheus", "uid": "dfdlzb2hrvlz4b" }, "description": "Total adjacent OSPF and OSPFv3 neighbors.", "fieldConfig": { "defaults": { "color": { "mode": "thresholds" }, "mappings": [ ], "thresholds": { "mode": "absolute", "steps": [ { "color": "red", "value": 0 }, { "color": "green", "value": 1 } ] }, "unit": "short" }, "overrides": [ ] }, "gridPos": { "h": 4, "w": 6, "x": 18, "y": 0 }, "id": 13, "options": { "colorMode": "background_solid", "graphMode": "none", "justifyMode": "center", "orientation": "horizontal", "percentChangeColorMode": "standard", "reduceOptions": { "calcs": [ "lastNotNull" ], "fields": "", "values": false }, "showPercentChange": false, "textMode": "auto", "wideLayout": true }, "pluginVersion": "12.3.3", "targets": [ { "datasource": { "type": "prometheus", "uid": "dfdlzb2hrvlz4b" }, "editorMode": "code", "expr": "(sum(bird_ospf_neighbor_adjacent_count{instance=~\"$instance\"}) or vector(0)) + (sum(bird_ospfv3_neighbor_adjacent_count{instance=~\"$instance\"}) or vector(0))", "format": "time_series", "instant": true, "legendFormat": "__auto", "range": false, "refId": "A" } ], "title": "OSPF Adjacent Neighbors", "type": "stat" }, { "datasource": { "type": "prometheus", "uid": "dfdlzb2hrvlz4b" }, "description": "Prefixes advertised to PITER-IX peers across the selected time range.", "fieldConfig": { "defaults": { "color": { "mode": "palette-classic" }, "custom": { "axisBorderShow": false, "axisCenteredZero": false, "axisColorMode": "text", "axisLabel": "", "axisPlacement": "left", "barAlignment": 0, "barWidthFactor": 0.6, "drawStyle": "line", "fillOpacity": 0, "gradientMode": "none", "hideFrom": { "legend": false, "tooltip": false, "viz": false }, "insertNulls": false, "lineInterpolation": "stepAfter", "lineWidth": 2, "pointSize": 5, "scaleDistribution": { "type": "linear" }, "showPoints": "never", "showValues": false, "spanNulls": false, "stacking": { "group": "A", "mode": "none" }, "thresholdsStyle": { "mode": "off" } }, "mappings": [ ], "thresholds": { "mode": "absolute", "steps": [ { "color": "green", "value": 0 }, { "color": "red", "value": 80 } ] }, "unit": "short" }, "overrides": [ { "matcher": { "id": "byValue", "options": { "op": "gte", "reducer": "allIsZero", "value": 0 } }, "properties": [ { "id": "custom.hideFrom", "value": { "legend": true, "tooltip": true, "viz": false } } ] }, { "matcher": { "id": "byValue", "options": { "op": "gte", "reducer": "allIsNull", "value": 0 } }, "properties": [ { "id": "custom.hideFrom", "value": { "legend": true, "tooltip": true, "viz": false } } ] }, { "matcher": { "id": "byValue", "options": { "op": "gte", "reducer": "allIsZero", "value": 0 } }, "properties": [ { "id": "custom.hideFrom", "value": { "legend": true, "tooltip": true, "viz": false } } ] }, { "matcher": { "id": "byValue", "options": { "op": "gte", "reducer": "allIsNull", "value": 0 } }, "properties": [ { "id": "custom.hideFrom", "value": { "legend": true, "tooltip": true, "viz": false } } ] }, { "matcher": { "id": "byValue", "options": { "op": "gte", "reducer": "allIsZero", "value": 0 } }, "properties": [ { "id": "custom.hideFrom", "value": { "legend": true, "tooltip": true, "viz": false } } ] }, { "matcher": { "id": "byValue", "options": { "op": "gte", "reducer": "allIsNull", "value": 0 } }, "properties": [ { "id": "custom.hideFrom", "value": { "legend": true, "tooltip": true, "viz": false } } ] } ] }, "gridPos": { "h": 8, "w": 12, "x": 0, "y": 4 }, "id": 2, "options": { "legend": { "calcs": [ "lastNotNull" ], "displayMode": "table", "placement": "bottom", "showLegend": true }, "tooltip": { "hideZeros": true, "mode": "multi", "sort": "desc" } }, "pluginVersion": "12.3.3", "targets": [ { "datasource": { "type": "prometheus", "uid": "dfdlzb2hrvlz4b" }, "dateTimeType": "DATETIME", "editorMode": "code", "expr": "bird_protocol_prefix_export_count{\n instance=~\"$instance\",\r\n name=~\"(dn42_peer_|dn42_)[0-9a-zA-Z]+\", \r\n name!~\"dn42_ospf\",\r\n name!~\"dn42_ospf6\", \r\n ip_version=\"4\"\r\n} \u003e 0\r\n", "format": "time_series", "formattedQuery": "SELECT $timeSeries as t, count() FROM $table WHERE $timeFilter GROUP BY t ORDER BY t", "intervalFactor": 1, "legendFormat": "{{name}}", "query": "SELECT\n $timeSeries as t,\n count()\nFROM $table\nWHERE $timeFilter\nGROUP BY t\nORDER BY t", "range": true, "refId": "A", "round": "0s" } ], "title": "PITER-IX · Exported Prefixes", "type": "timeseries" }, { "datasource": { "type": "prometheus", "uid": "dfdlzb2hrvlz4b" }, "description": "Prefixes received from PITER-IX peers across the selected time range.", "fieldConfig": { "defaults": { "color": { "mode": "palette-classic" }, "custom": { "axisBorderShow": false, "axisCenteredZero": false, "axisColorMode": "text", "axisLabel": "prefixes", "axisPlacement": "left", "barAlignment": 0, "barWidthFactor": 0.6, "drawStyle": "line", "fillOpacity": 0, "gradientMode": "none", "hideFrom": { "legend": false, "tooltip": false, "viz": false }, "insertNulls": false, "lineInterpolation": "stepAfter", "lineWidth": 2, "pointSize": 5, "scaleDistribution": { "type": "linear" }, "showPoints": "never", "showValues": false, "spanNulls": false, "stacking": { "group": "A", "mode": "none" }, "thresholdsStyle": { "mode": "off" } }, "mappings": [ ], "thresholds": { "mode": "absolute", "steps": [ { "color": "green", "value": 0 }, { "color": "red", "value": 80 } ] }, "unit": "none" }, "overrides": [ { "matcher": { "id": "byValue", "options": { "op": "gte", "reducer": "allIsZero", "value": 0 } }, "properties": [ { "id": "custom.hideFrom", "value": { "legend": true, "tooltip": true, "viz": false } } ] }, { "matcher": { "id": "byValue", "options": { "op": "gte", "reducer": "allIsNull", "value": 0 } }, "properties": [ { "id": "custom.hideFrom", "value": { "legend": true, "tooltip": true, "viz": false } } ] }, { "matcher": { "id": "byValue", "options": { "op": "gte", "reducer": "allIsZero", "value": 0 } }, "properties": [ { "id": "custom.hideFrom", "value": { "legend": true, "tooltip": true, "viz": false } } ] }, { "matcher": { "id": "byValue", "options": { "op": "gte", "reducer": "allIsNull", "value": 0 } }, "properties": [ { "id": "custom.hideFrom", "value": { "legend": true, "tooltip": true, "viz": false } } ] }, { "matcher": { "id": "byValue", "options": { "op": "gte", "reducer": "allIsZero", "value": 0 } }, "properties": [ { "id": "custom.hideFrom", "value": { "legend": true, "tooltip": true, "viz": false } } ] }, { "matcher": { "id": "byValue", "options": { "op": "gte", "reducer": "allIsNull", "value": 0 } }, "properties": [ { "id": "custom.hideFrom", "value": { "legend": true, "tooltip": true, "viz": false } } ] } ] }, "gridPos": { "h": 8, "w": 12, "x": 12, "y": 4 }, "id": 3, "options": { "legend": { "calcs": [ "lastNotNull" ], "displayMode": "table", "placement": "bottom", "showLegend": true }, "tooltip": { "hideZeros": true, "mode": "multi", "sort": "desc" } }, "pluginVersion": "12.3.3", "targets": [ { "datasource": { "type": "prometheus", "uid": "dfdlzb2hrvlz4b" }, "dateTimeType": "DATETIME", "editorMode": "code", "expr": "bird_protocol_prefix_import_count{\n instance=~\"$instance\",\r\n name=~\"(dn42_peer_|dn42_)[0-9a-zA-Z]+\", \r\n name!~\"dn42_ospf\",\r\n name!~\"dn42_ospf6\", \r\n ip_version=\"4\"\r\n} \u003e 0", "format": "time_series", "formattedQuery": "SELECT $timeSeries as t, count() FROM $table WHERE $timeFilter GROUP BY t ORDER BY t", "intervalFactor": 1, "legendFormat": "{{name}}", "query": "SELECT\n $timeSeries as t,\n count()\nFROM $table\nWHERE $timeFilter\nGROUP BY t\nORDER BY t", "range": true, "refId": "A", "round": "0s" } ], "title": "PITER-IX · Imported Prefixes", "type": "timeseries" }, { "datasource": { "type": "prometheus", "uid": "dfdlzb2hrvlz4b" }, "description": "Accepted route updates and withdrawals per second. Spikes make routing churn immediately visible.", "fieldConfig": { "defaults": { "color": { "mode": "palette-classic" }, "custom": { "axisBorderShow": false, "axisCenteredZero": false, "axisColorMode": "text", "axisLabel": "events / second", "axisPlacement": "left", "barAlignment": 0, "barWidthFactor": 0.6, "drawStyle": "line", "fillOpacity": 8, "gradientMode": "opacity", "hideFrom": { "legend": false, "tooltip": false, "viz": false }, "insertNulls": false, "lineInterpolation": "smooth", "lineWidth": 2, "pointSize": 4, "scaleDistribution": { "type": "linear" }, "showPoints": "never", "showValues": false, "spanNulls": true, "stacking": { "group": "A", "mode": "none" }, "thresholdsStyle": { "mode": "off" } }, "mappings": [ ], "thresholds": { "mode": "absolute", "steps": [ { "color": "green", "value": 0 } ] }, "unit": "ops" }, "overrides": [ ] }, "gridPos": { "h": 8, "w": 12, "x": 0, "y": 12 }, "id": 14, "options": { "legend": { "calcs": [ "lastNotNull" ], "displayMode": "table", "placement": "bottom", "showLegend": true }, "tooltip": { "hideZeros": true, "mode": "multi", "sort": "desc" } }, "pluginVersion": "12.3.3", "targets": [ { "datasource": { "type": "prometheus", "uid": "dfdlzb2hrvlz4b" }, "editorMode": "code", "expr": "sum by (instance) (rate(bird_protocol_changes_update_import_accept_count{instance=~\"$instance\"}[$__rate_interval]))", "format": "time_series", "legendFormat": "{{instance}} · imported updates", "range": true, "refId": "A" }, { "datasource": { "type": "prometheus", "uid": "dfdlzb2hrvlz4b" }, "editorMode": "code", "expr": "sum by (instance) (rate(bird_protocol_changes_withdraw_import_accept_count{instance=~\"$instance\"}[$__rate_interval]))", "format": "time_series", "legendFormat": "{{instance}} · imported withdrawals", "range": true, "refId": "B" }, { "datasource": { "type": "prometheus", "uid": "dfdlzb2hrvlz4b" }, "editorMode": "code", "expr": "sum by (instance) (rate(bird_protocol_changes_update_export_accept_count{instance=~\"$instance\"}[$__rate_interval]))", "format": "time_series", "legendFormat": "{{instance}} · exported updates", "range": true, "refId": "C" }, { "datasource": { "type": "prometheus", "uid": "dfdlzb2hrvlz4b" }, "editorMode": "code", "expr": "sum by (instance) (rate(bird_protocol_changes_withdraw_export_accept_count{instance=~\"$instance\"}[$__rate_interval]))", "format": "time_series", "legendFormat": "{{instance}} · exported withdrawals", "range": true, "refId": "D" } ], "title": "Routing Activity · Updates \u0026 Withdrawals", "type": "timeseries" }, { "datasource": { "type": "prometheus", "uid": "dfdlzb2hrvlz4b" }, "description": "Only non-established BGP sessions are listed. An empty table means all matched sessions are healthy.", "fieldConfig": { "defaults": { "color": { "mode": "thresholds" }, "custom": { "align": "auto", "cellOptions": { "type": "auto" }, "filterable": true, "footer": { "reducers": [ ] }, "inspect": false }, "mappings": [ { "options": { "0": { "color": "red", "index": 0, "text": "DOWN" } }, "type": "value" } ], "thresholds": { "mode": "absolute", "steps": [ { "color": "red", "value": 0 } ] } }, "overrides": [ ] }, "gridPos": { "h": 8, "w": 12, "x": 12, "y": 12 }, "id": 15, "options": { "cellHeight": "sm", "footer": { "countRows": false, "enablePagination": true, "fields": "", "reducer": [ "sum" ], "show": false }, "showHeader": true, "sortBy": [ { "desc": false, "displayName": "instance" } ] }, "pluginVersion": "12.3.3", "targets": [ { "datasource": { "type": "prometheus", "uid": "dfdlzb2hrvlz4b" }, "editorMode": "code", "expr": "bird_protocol_up{proto=\"BGP\",instance=~\"$instance\"} == 0", "format": "table", "instant": true, "legendFormat": "{{instance}} · {{name}} · IPv{{ip_version}}", "range": false, "refId": "A" } ], "title": "BGP Sessions Requiring Attention", "transformations": [ { "id": "organize", "options": { "excludeByName": { "Time": true, "__name__": true, "export_filter": true, "import_filter": true, "job": true, "proto": true }, "indexByName": { "Value": 4, "instance": 0, "ip_version": 2, "name": 1, "state": 3 }, "renameByName": { "Value": "Status", "instance": "Router", "ip_version": "IP", "name": "Session", "state": "State" } } } ], "type": "table" }, { "datasource": { "type": "prometheus", "uid": "dfdlzb2hrvlz4b" }, "description": "IPv4 and IPv6 prefixes exported by the BIRD protocol named flapalerted. Use the Router selector to isolate a node.", "fieldConfig": { "defaults": { "color": { "mode": "palette-classic" }, "custom": { "axisBorderShow": false, "axisCenteredZero": false, "axisColorMode": "text", "axisLabel": "events / second", "axisPlacement": "left", "barAlignment": 0, "barWidthFactor": 0.6, "drawStyle": "line", "fillOpacity": 6, "gradientMode": "opacity", "hideFrom": { "legend": false, "tooltip": false, "viz": false }, "insertNulls": false, "lineInterpolation": "smooth", "lineWidth": 2, "pointSize": 4, "scaleDistribution": { "type": "linear" }, "showPoints": "never", "showValues": false, "spanNulls": true, "stacking": { "group": "A", "mode": "none" }, "thresholdsStyle": { "mode": "off" } }, "mappings": [ ], "thresholds": { "mode": "absolute", "steps": [ { "color": "green", "value": 0 } ] }, "unit": "short" }, "overrides": [ ] }, "gridPos": { "h": 8, "w": 24, "x": 0, "y": 20 }, "id": 16, "options": { "legend": { "calcs": [ "lastNotNull", "max" ], "displayMode": "table", "placement": "bottom", "showLegend": true }, "tooltip": { "hideZeros": true, "mode": "multi", "sort": "desc" } }, "pluginVersion": "12.3.3", "targets": [ { "datasource": { "type": "prometheus", "uid": "dfdlzb2hrvlz4b" }, "editorMode": "code", "expr": "bird_protocol_prefix_export_count{name=\"flapalerted\",instance=~\"$instance\"}", "format": "time_series", "legendFormat": "{{instance}} · IPv{{ip_version}}", "range": true, "refId": "A" } ], "title": "FlapAlerted · Exported Prefixes", "type": "timeseries" } ], "preload": false, "refresh": "30s", "schemaVersion": 42, "tags": [ ], "templating": { "list": [ { "current": { "text": "All", "value": "$__all" }, "datasource": { "type": "prometheus", "uid": "dfdlzb2hrvlz4b" }, "definition": "label_values(up{job=\"bird_exporter\"}, instance)", "includeAll": true, "label": "Router", "multi": true, "name": "instance", "options": [ ], "query": { "query": "label_values(up{job=\"bird_exporter\"}, instance)", "refId": "PrometheusVariableQueryEditor-VariableQuery" }, "refresh": 1, "regex": "", "sort": 1, "type": "query" } ] }, "time": { "from": "now-5m", "to": "now" }, "timepicker": { }, "timezone": "", "title": "BIRD · Routing Overview", "uid": "f6bde99c-ee14-44cf-9b57-17052329ab55", "version": 15 }{/collapse-item}{/collapse}参考文献Grafana Labs - FRR Exporter - BGP DashboardGrafana Labs - BIRD RS DashboardGrafana Labs - Node Exporter Full DashboardGitHub - czerwonk/bird_exporterGitHub - tynany/frr_exporterPrometheus DocumentationGrafana Documentation